
.png)

Case study: Our experience creating a boat show companion app
CMDN develops a quick companion app for Spain's first Electric Boat Show.


Debugging frontend code is an essential skill for web developers. Understanding and mastering various debugging techniques can significantly improve your ability to identify and resolve issues quickly. In this article, we will explore two fundamental and powerful methods of debugging frontend code: using console.log and employing breakpoints/debugger.
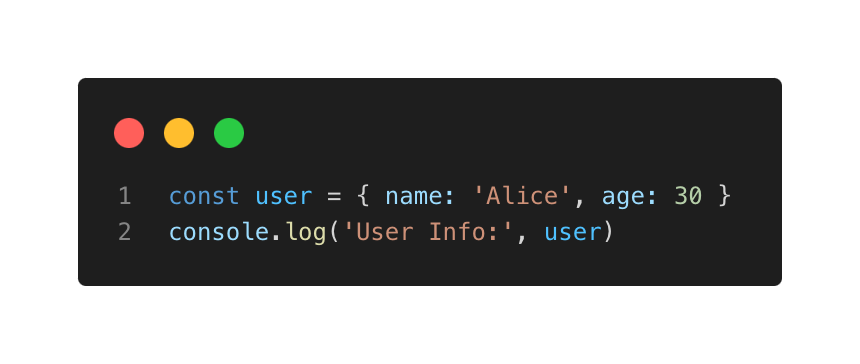
console.logOne of the simplest yet most effective ways to debug frontend code is by using console.log. this method allow developers to print information to the browser’s console, providing insight into the application’s state and behavior.
console.logThe console.log method prints any specified message or variable to the console. It’s incredibly versatile and can be used to display strings, numbers, arrays, objects, and more.
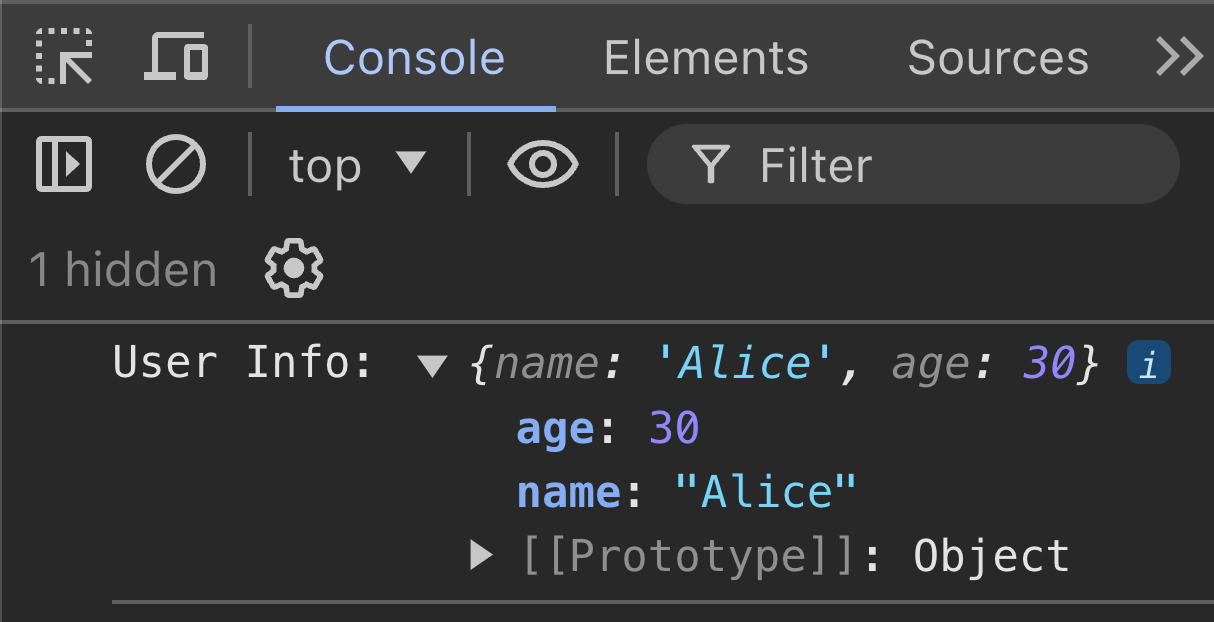
The output provides a collapsible list of the object’s properties, allowing you to drill down into nested objects and arrays.:
console.logHowever, relying solely on console.log for debugging can lead to cluttered code and missed breakpoints. This is where breakpoints and the debugger statement come into play.
debuggerBreakpoints and the debugger statement offer a more sophisticated approach to debugging by allowing you to pause code execution and inspect the program's state at specific points.
Modern browsers come equipped with developer tools that allow you to set breakpoints in your code. Breakpoints pause the execution at a specific line, enabling you to inspect variables, evaluate expressions, and step through code line by line.
To set a breakpoint in Chrome:
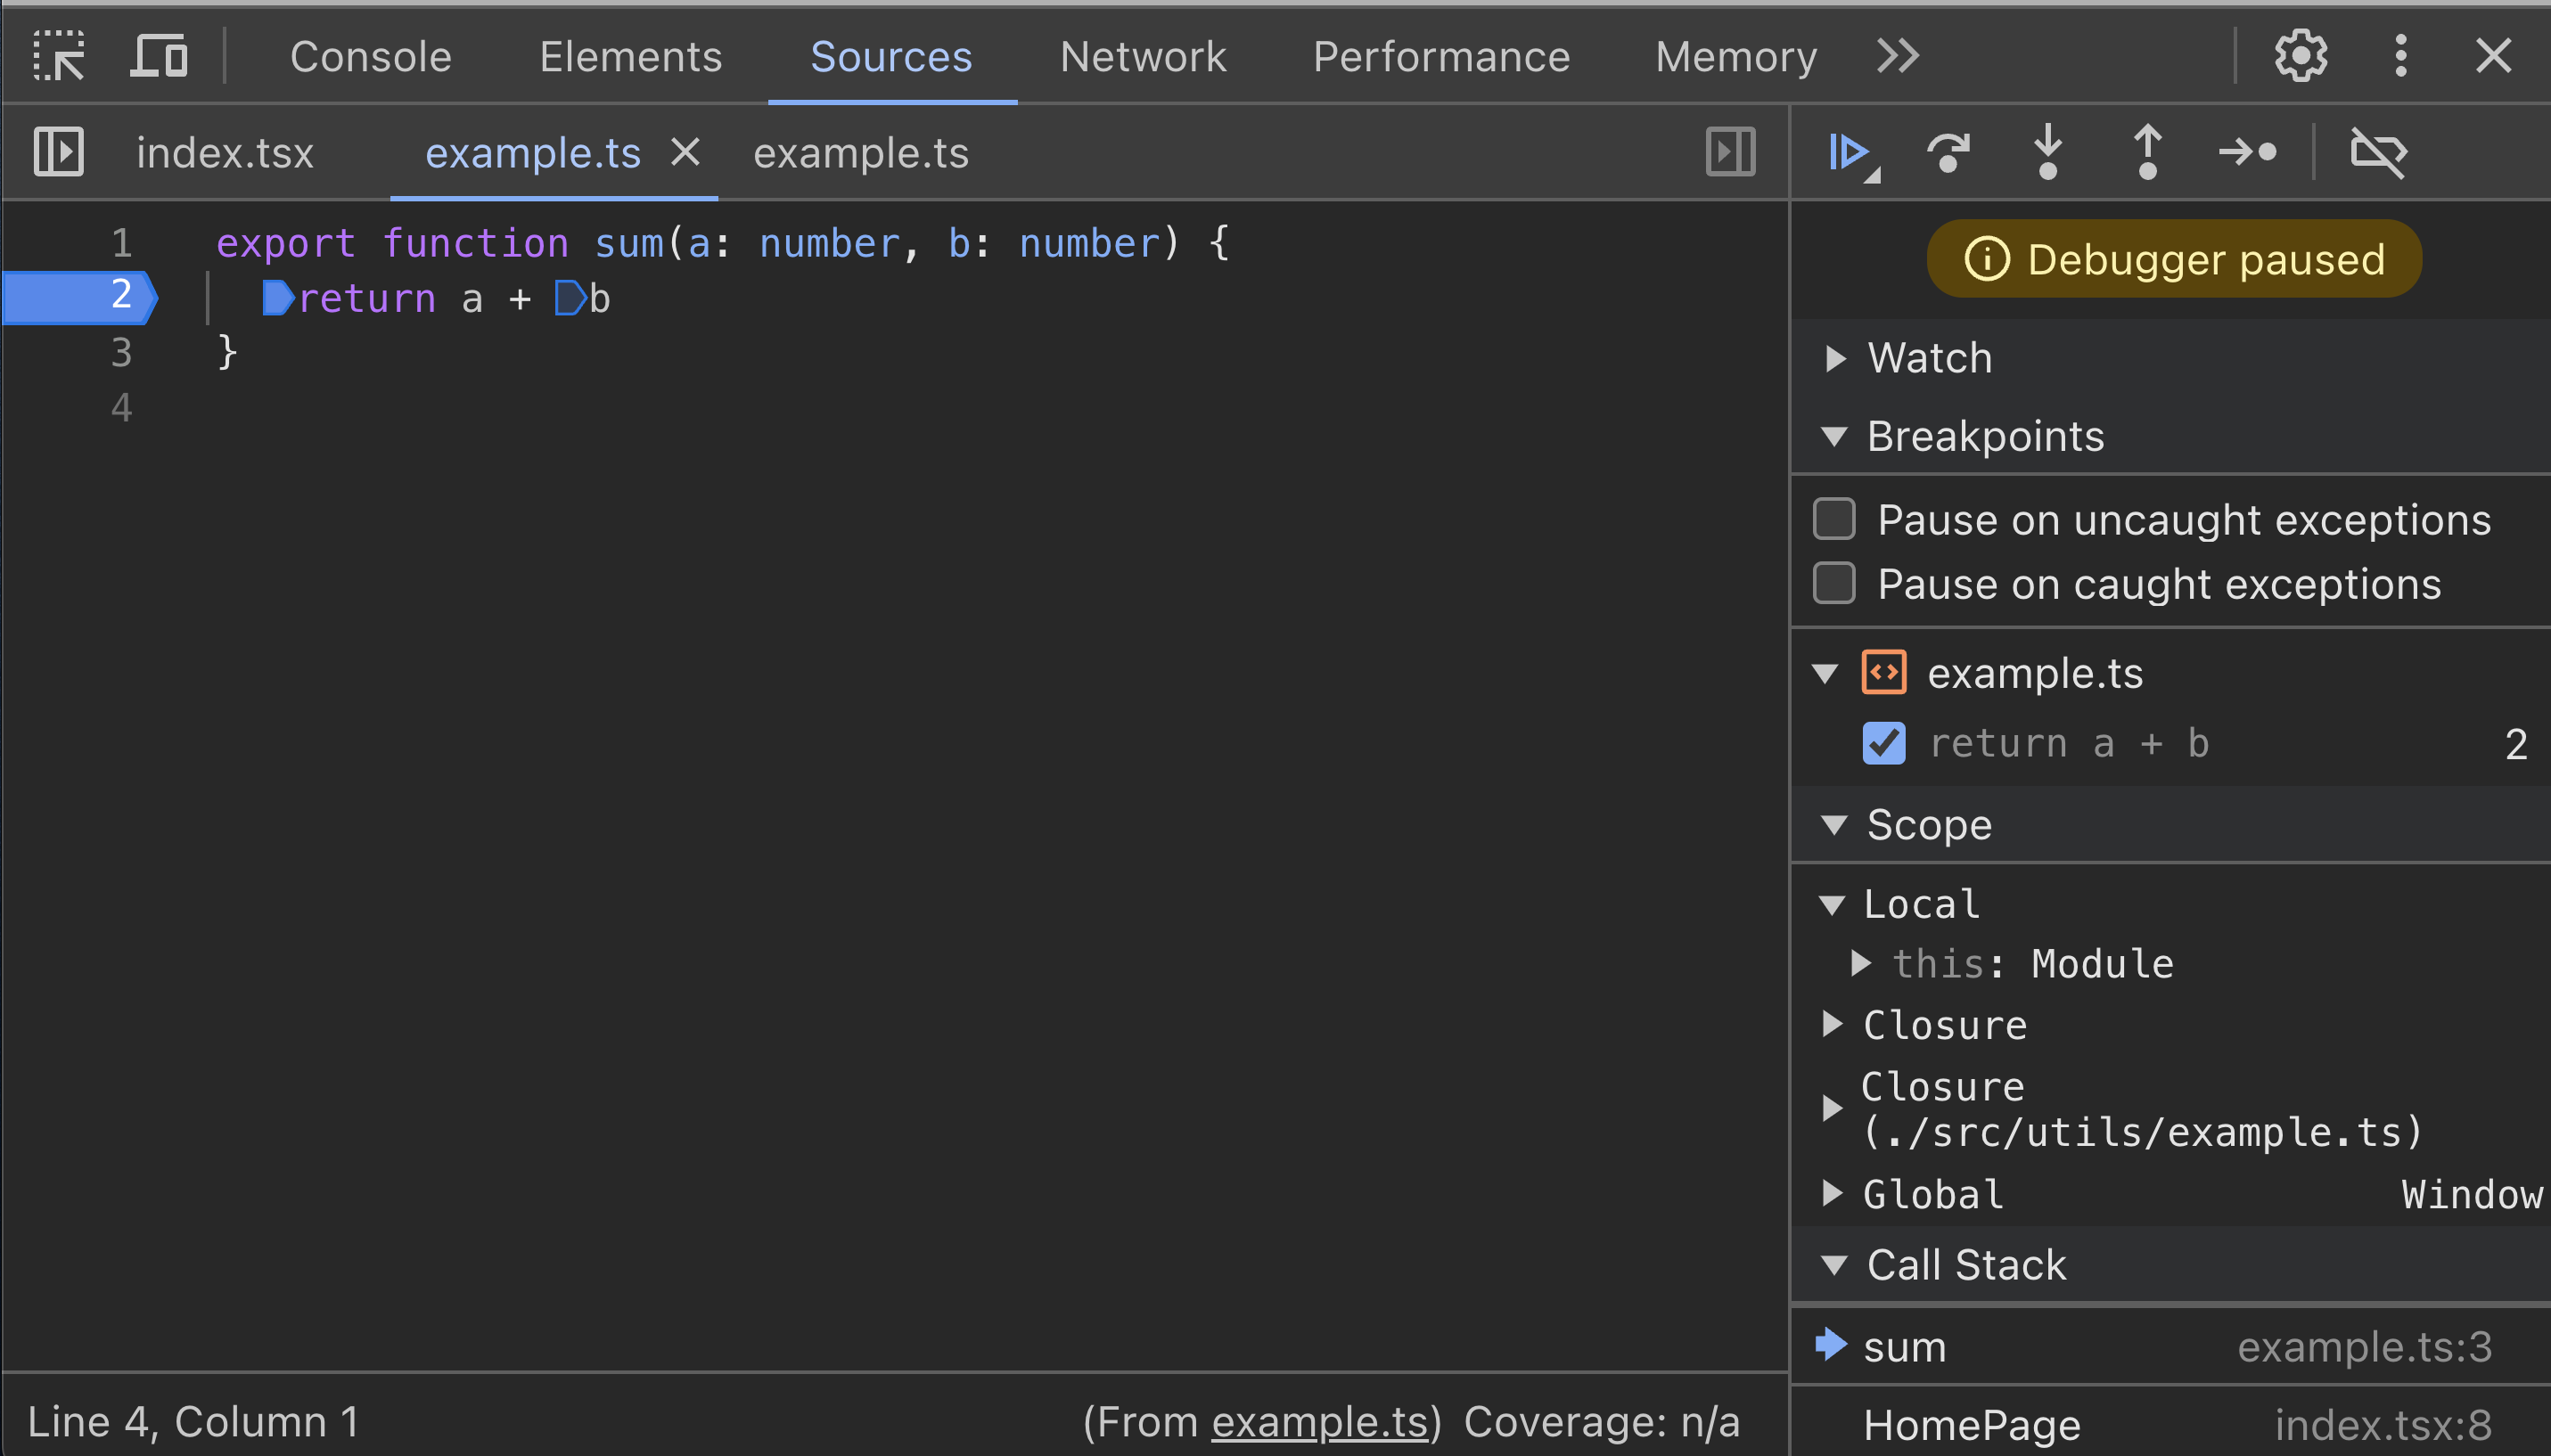
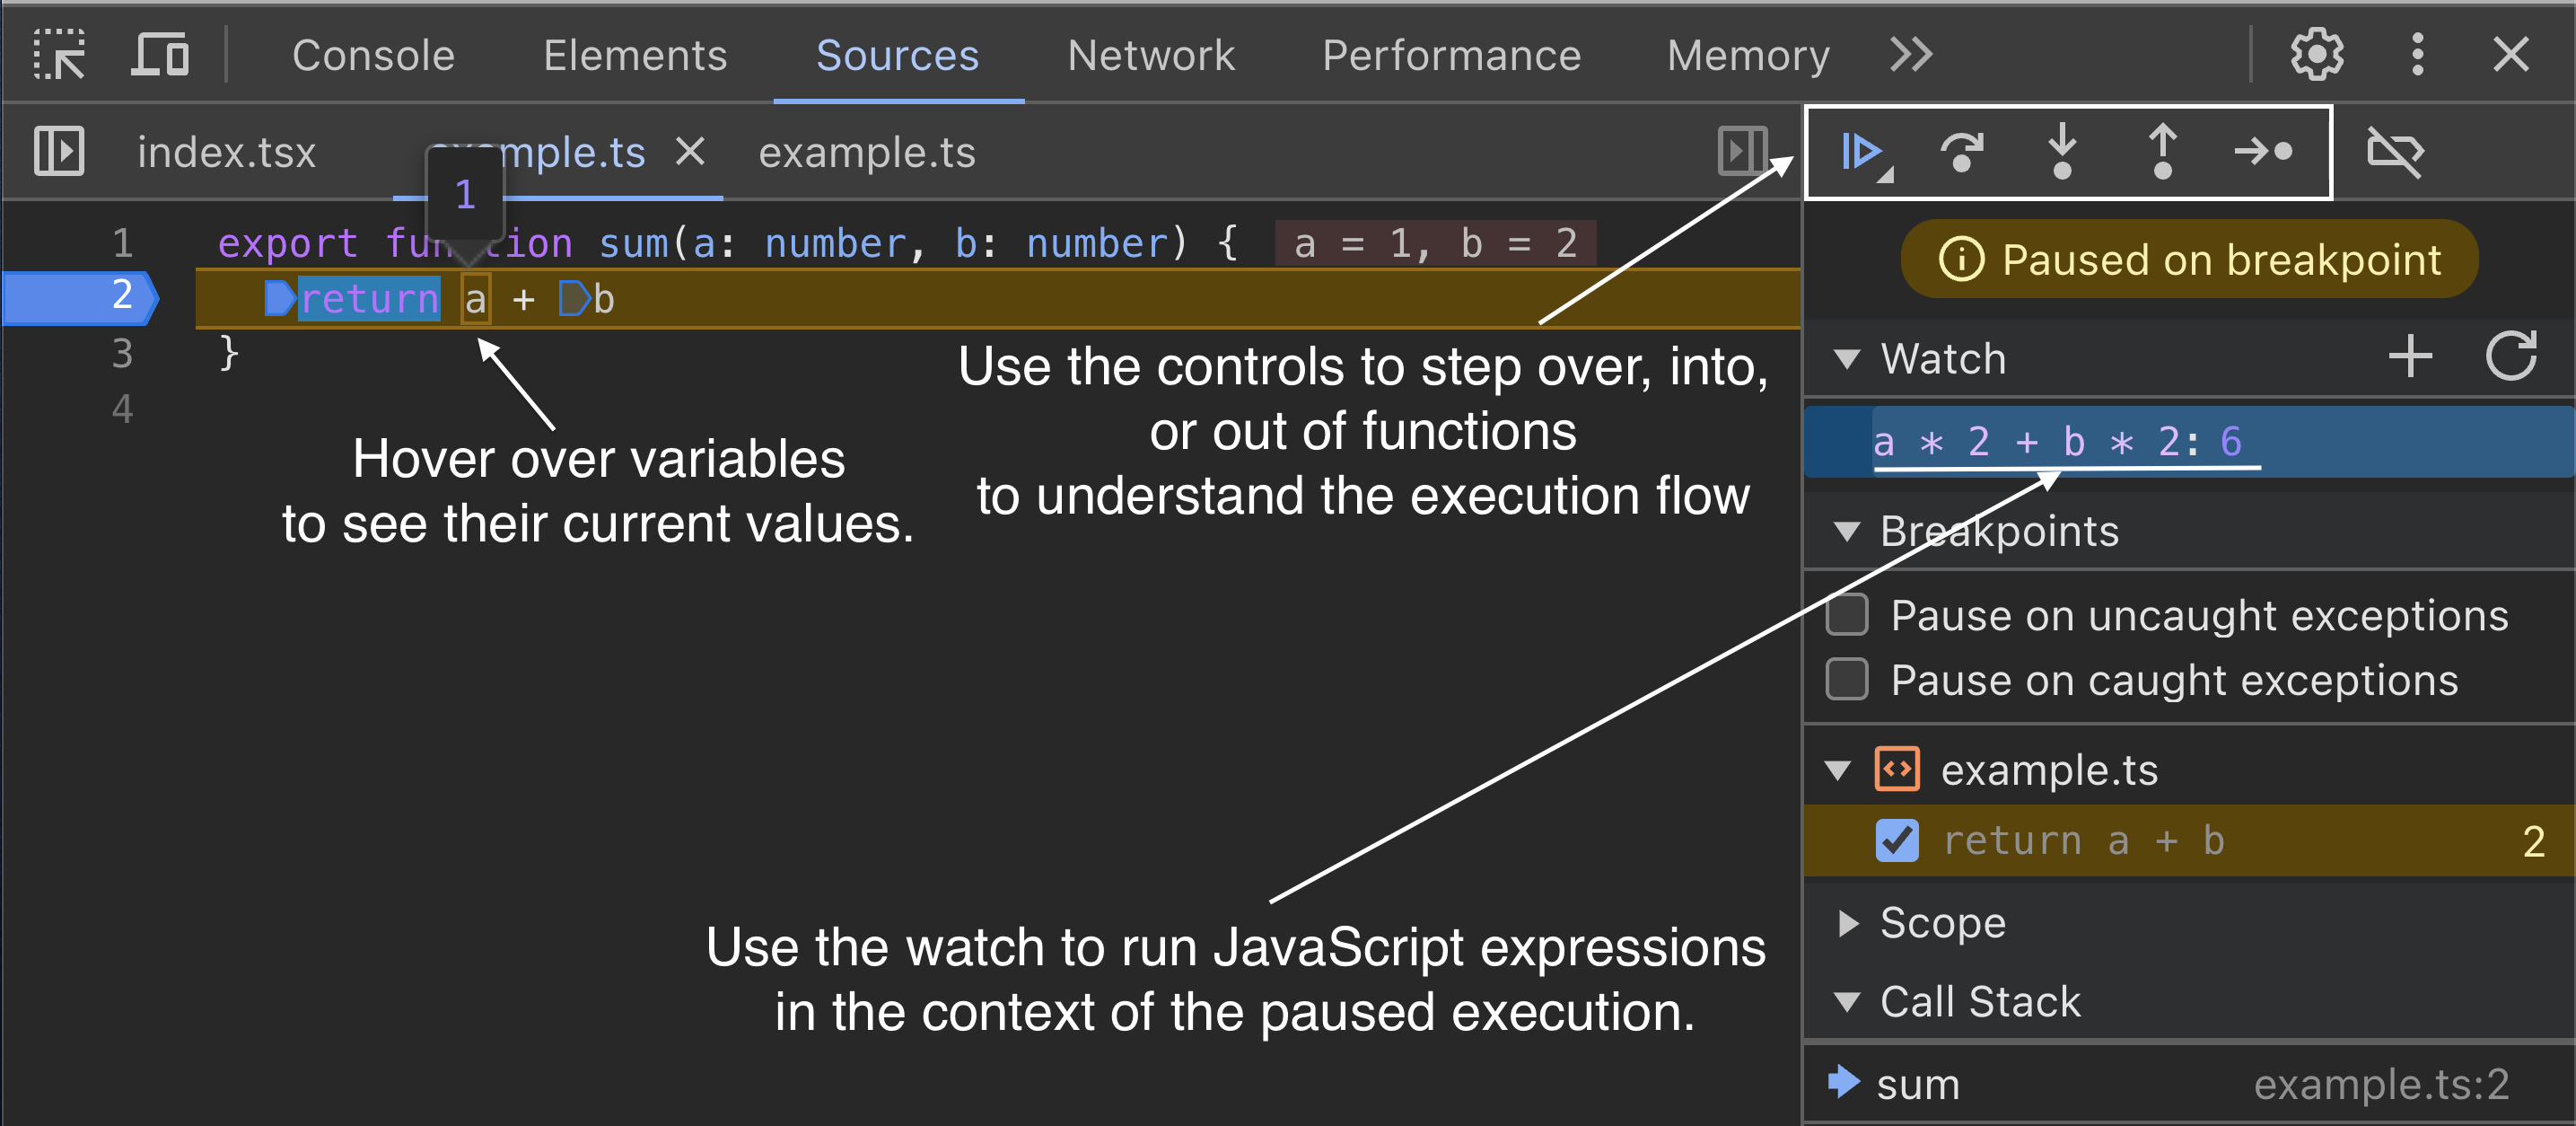
Once the breakpoint is hit, you can:
debugger StatementThe debugger statement acts like a manual breakpoint. When the JavaScript engine encounters this statement, it pauses execution and brings up the debugging interface.
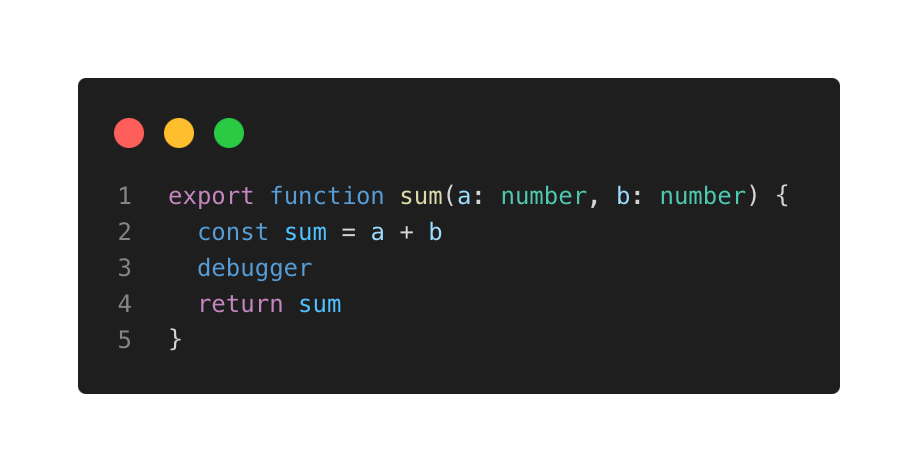
When this code runs, the debugger will pause execution at the debugger statement, allowing you to inspect the state at that exact point.
debuggerBoth console.log and breakpoints/debugger are indispensable tools in a web developer's debugging toolkit. console.log offer quick and versatile logging, while breakpoints and the debugger statement provide deeper insight and control over code execution. By mastering these techniques, developers can efficiently diagnose and fix frontend issues, leading to more robust and reliable applications.
.png)
